Top charts
- Referrers
- Search terms
- Pages
- Scroll depth
- Browsers
- Devices
- Operating systems
- Resolutions
- Custom events
- Goals
- Locations
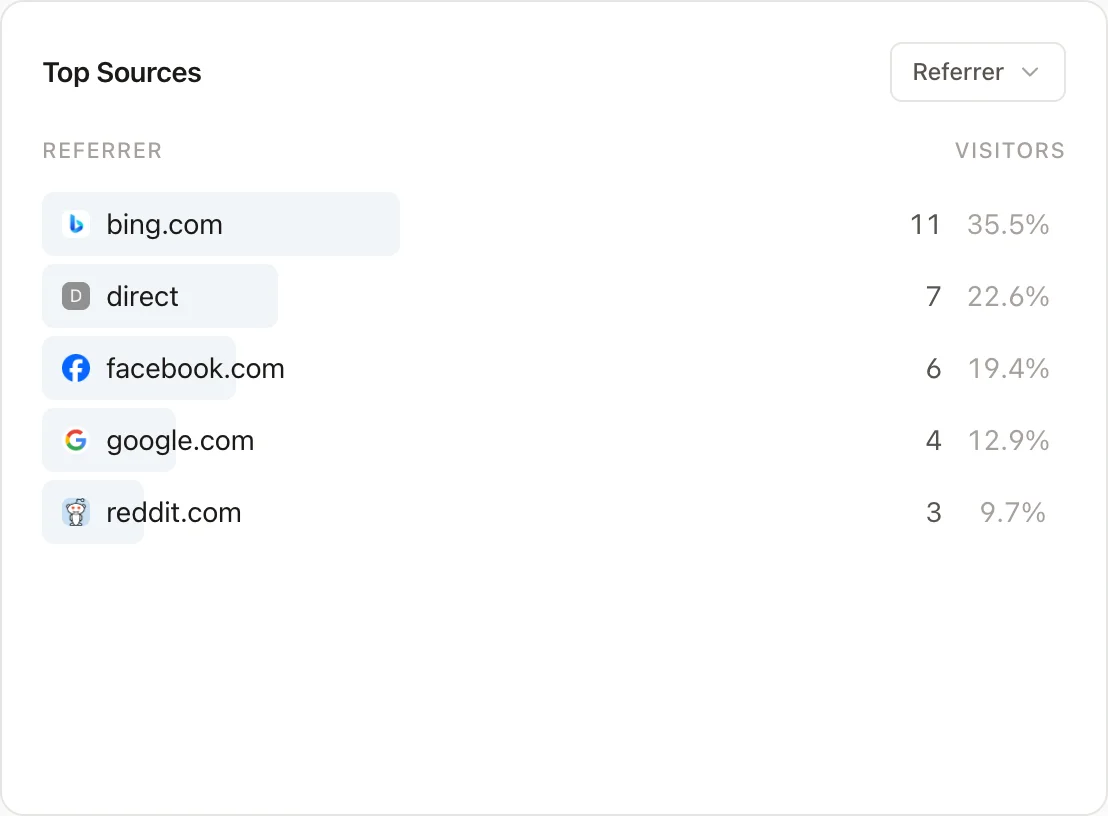
Referrers
The Referrers chart shows which referral sources are driving traffic to your website. Click on the tabs to see referrers by referrer, UTM source, UTM medium, or UTM campaign. Clicking on any referral source filters the dashboard by that source.
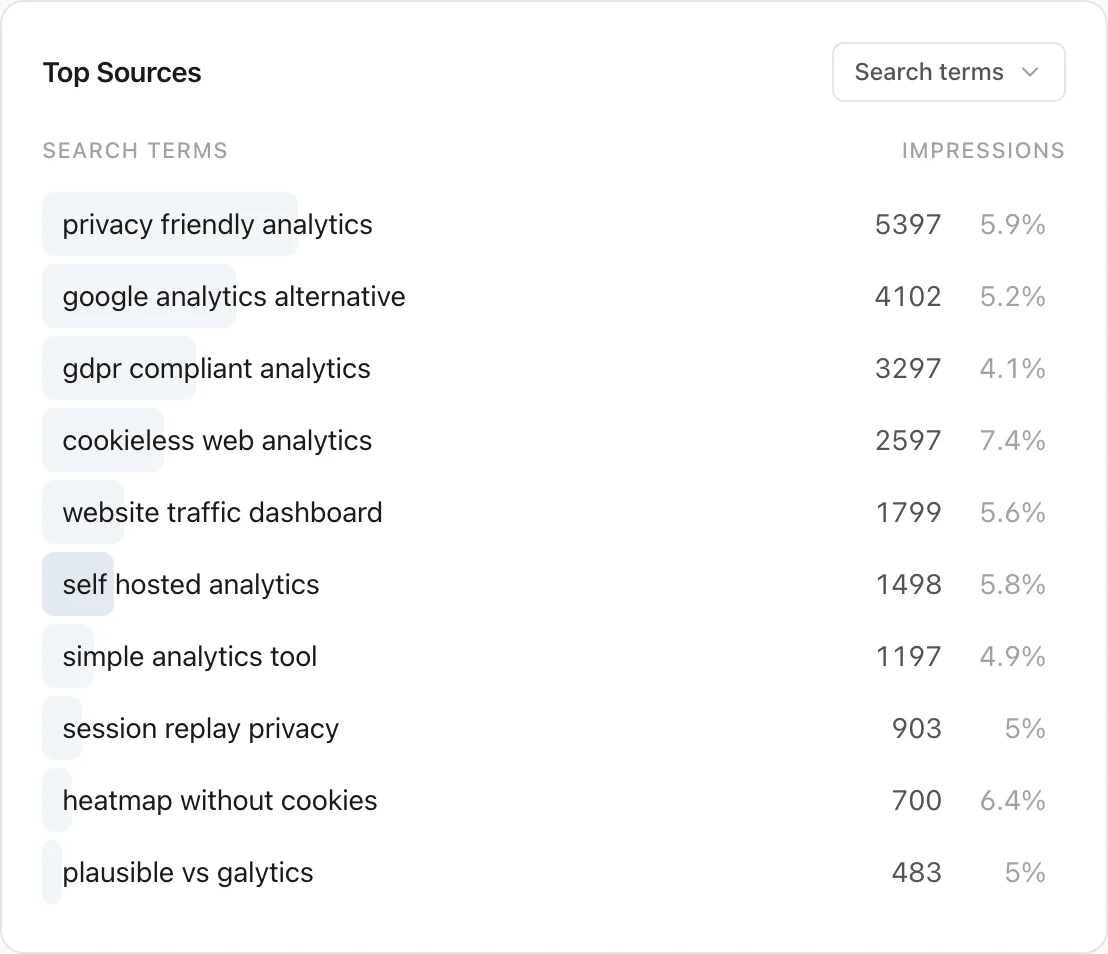
Search terms
When you connect Google Search Console, a Search terms tab appears in the Top Sources chart. It shows the organic Google search queries that drove traffic to your site, with the number of impressions each query received and its click-through rate in the selected period. This tab is only visible once Search Console is connected.
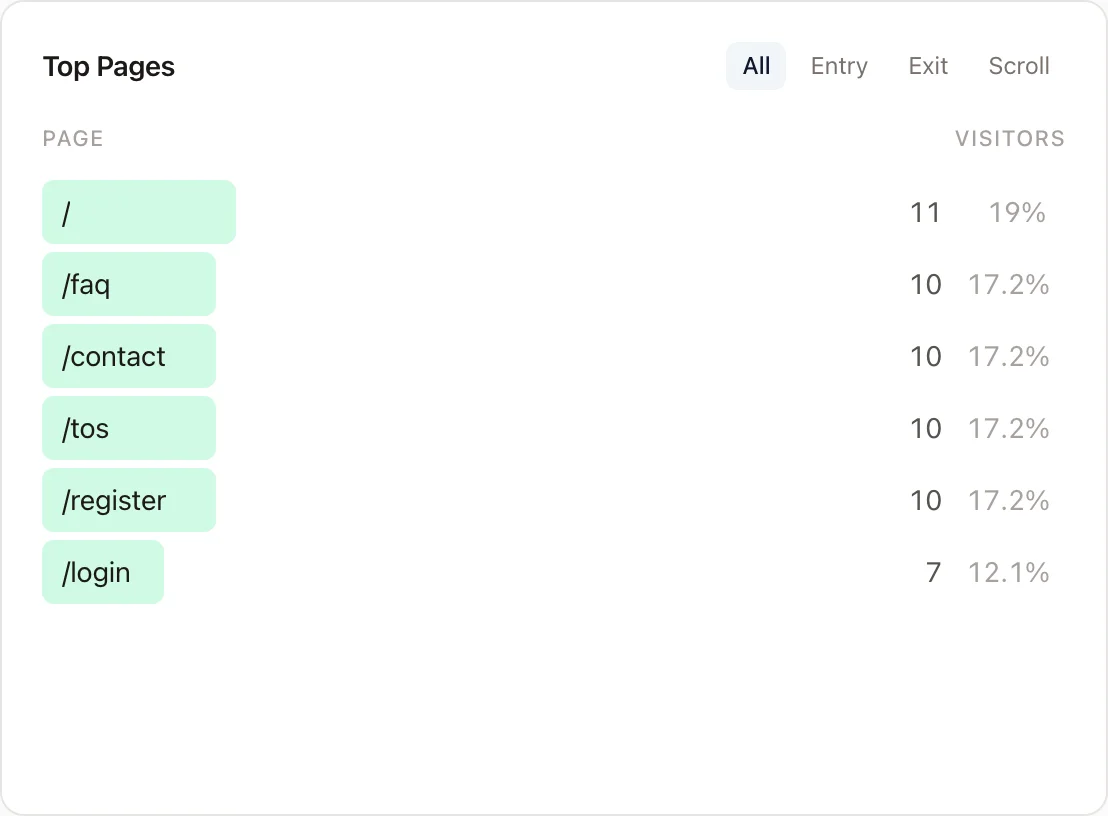
Pages
This section lists the pages on your website receiving the most pageviews. Use the tabs to view all pages, only entry and exit pages, or scroll depth per page.
Scroll depth
The Scroll depth tab in the Pages chart shows the average maximum scroll depth per page, expressed as a percentage of the total page height. A value of 100% means visitors scrolled to the very bottom on average.
Use this to identify which pages hold visitor attention and which pages visitors abandon without reading.
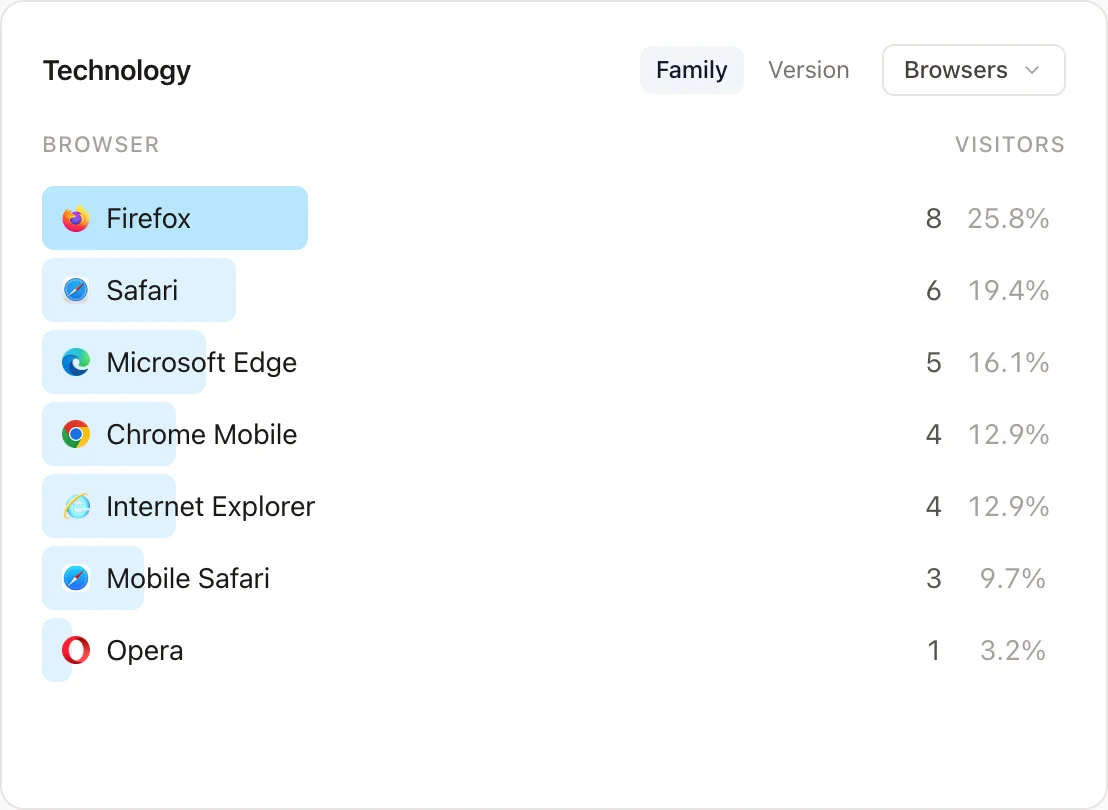
Browsers
The Browsers chart displays the browsers used by visitors to your website, derived from the User-Agent HTTP header. The full User-Agent is discarded. Use the tabs to view either browser families or full browser versions.
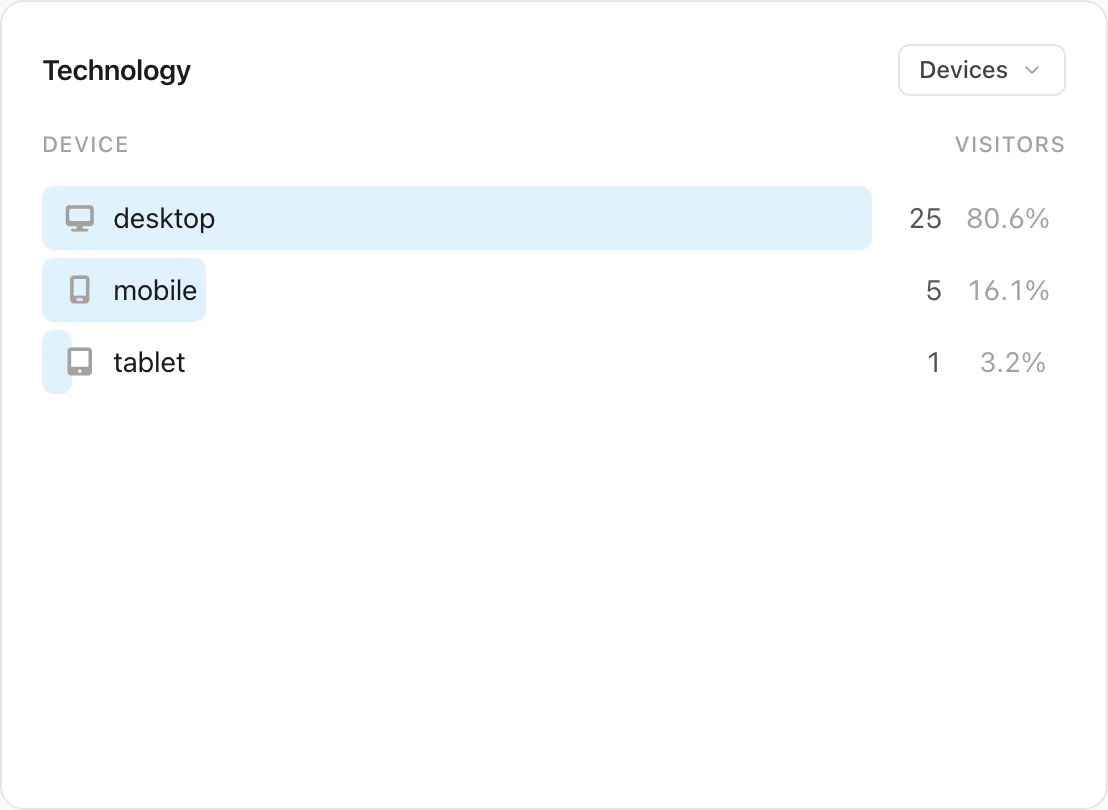
Devices
This chart shows the devices used by visitors when accessing your site. This information is derived from the User-Agent HTTP header, and the full User-Agent is discarded.
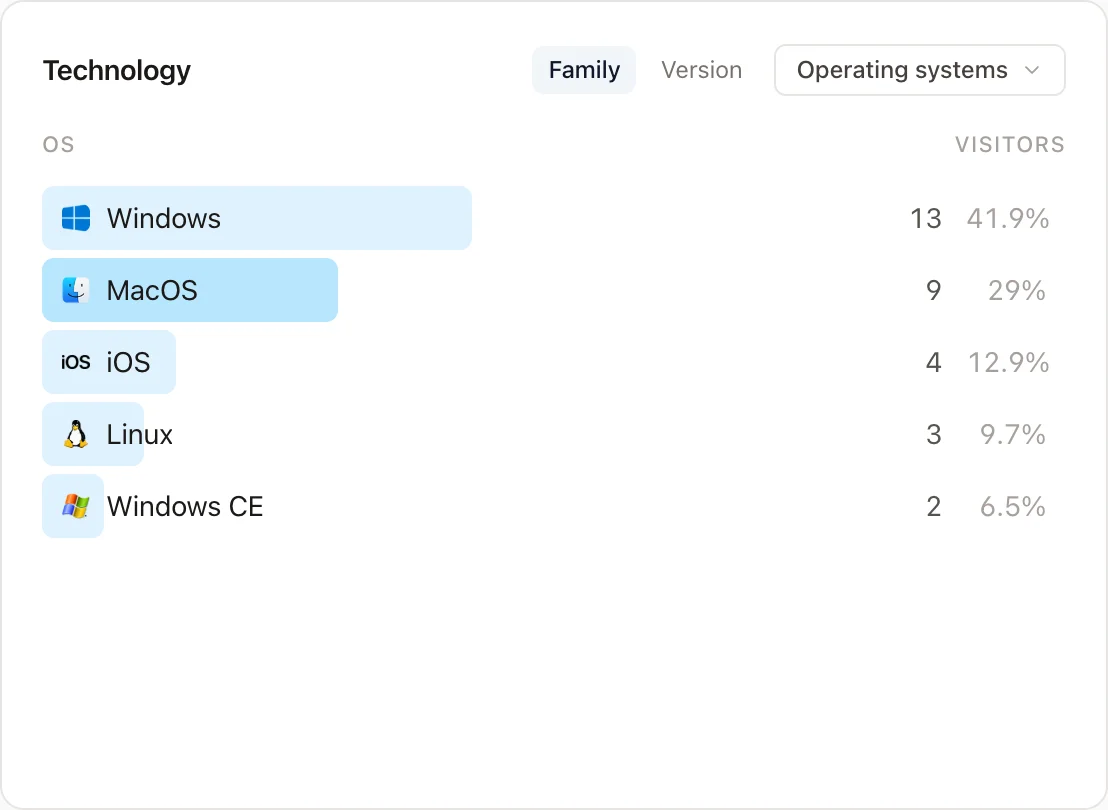
Operating systems
This chart displays the operating systems used by your website visitors, derived from the User-Agent HTTP header. The full User-Agent is discarded. Use the tabs to group by either operating system family or version.
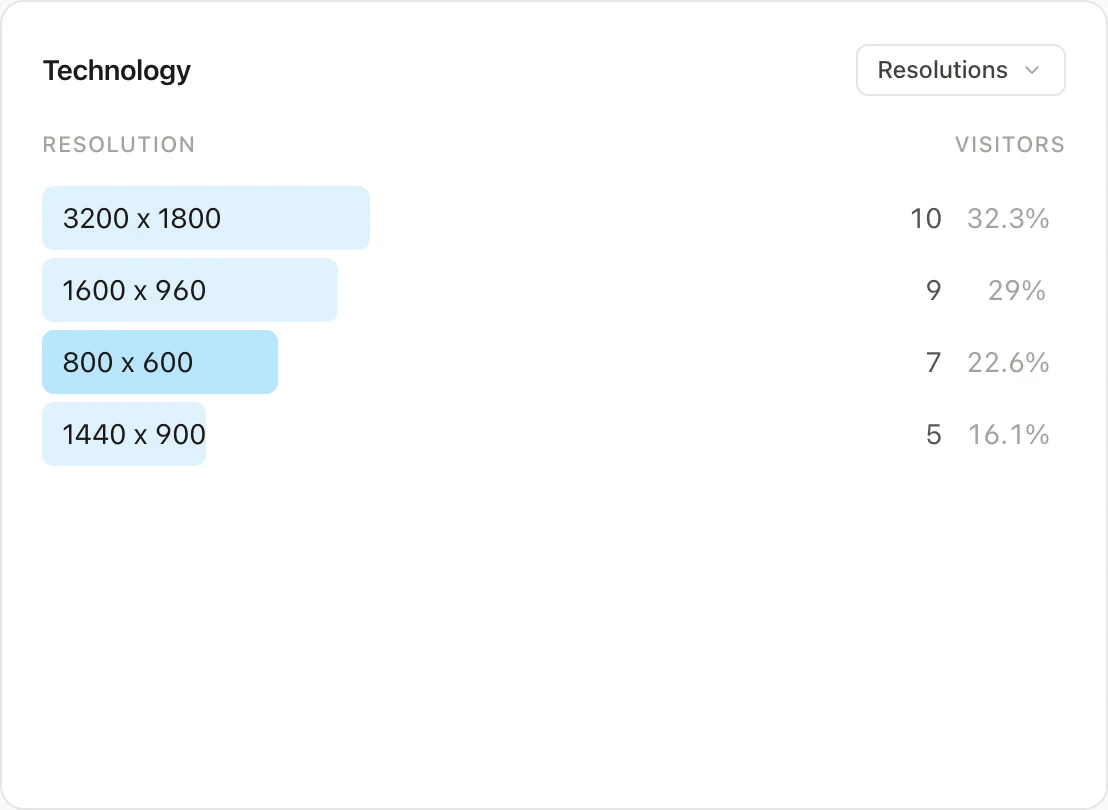
Resolutions
This chart shows the most commonly used screen resolutions among your site visitors. This metric captures the resolution of the screen, not just the browser window size, using window.screen.width and window.screen.height.
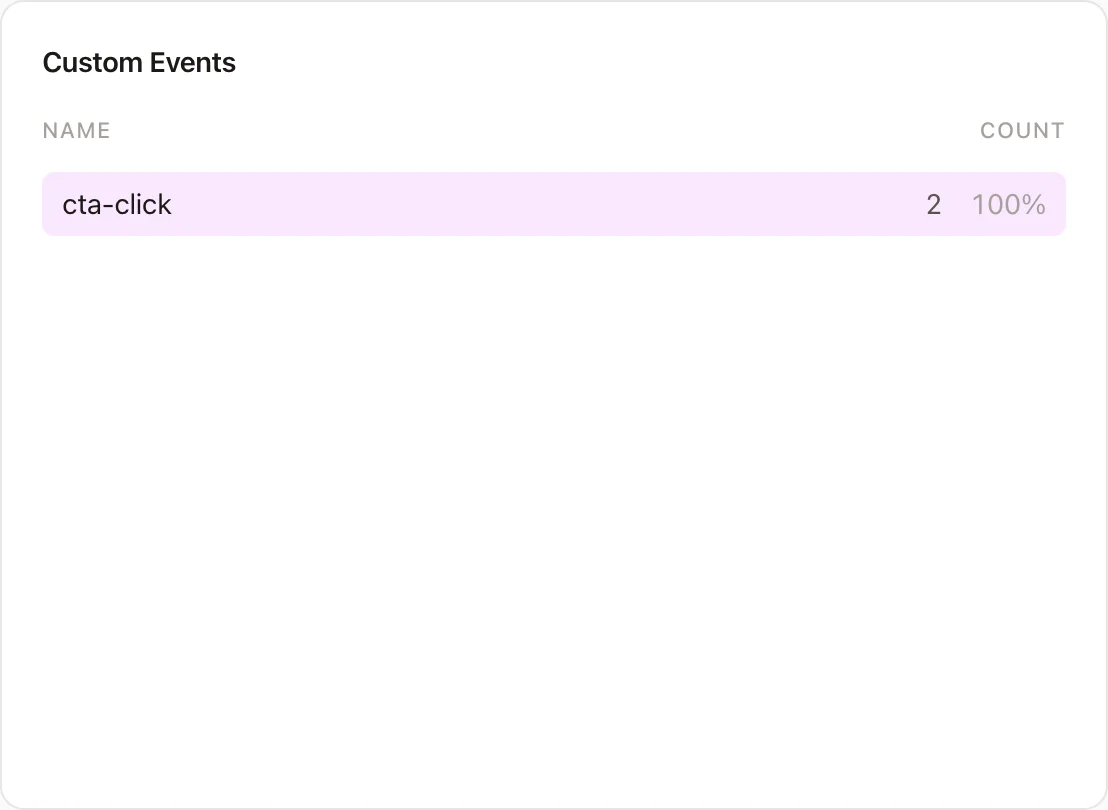
Custom events
This section displays custom events triggered by users on your site. Refer to the detailed documentation for working with custom events.
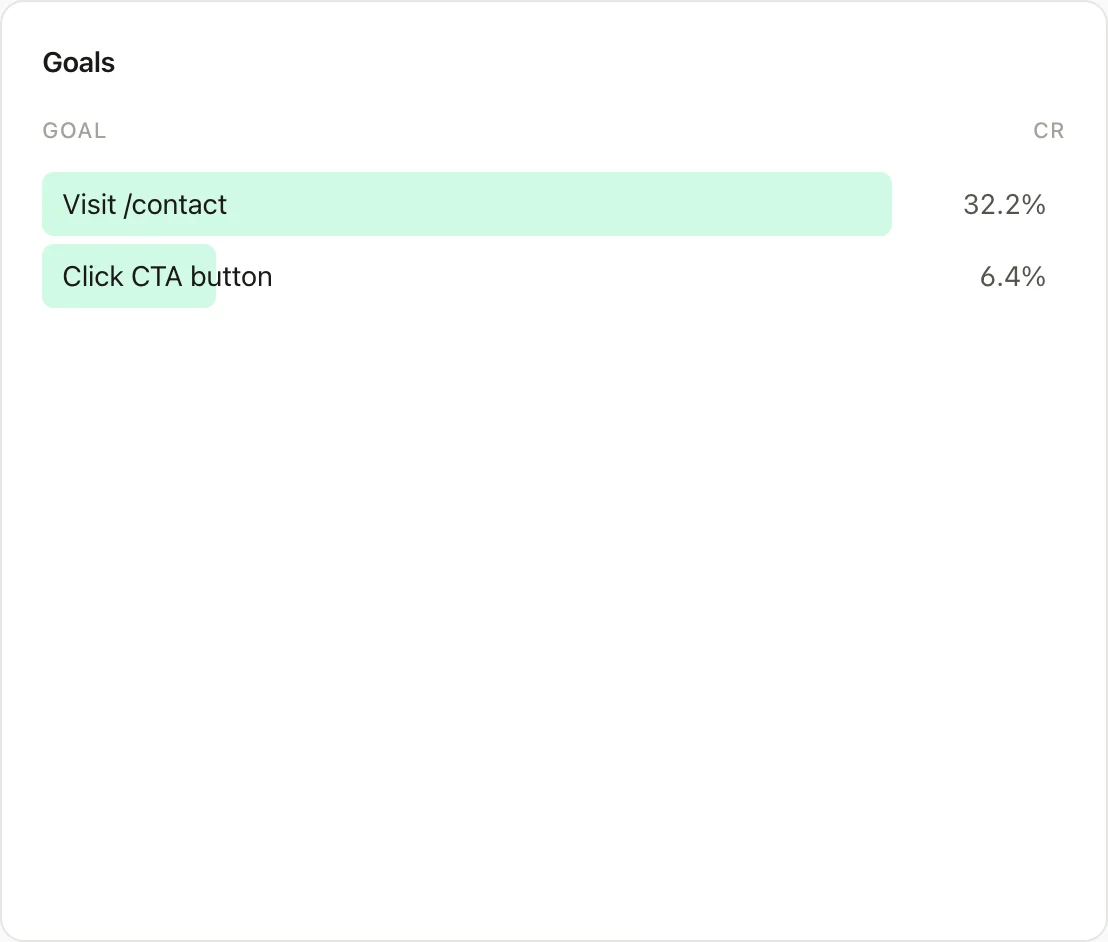
Goals
This chart shows the conversion rate for the goals you've set up, indicating how many visitors complete these goals. For instructions on setting up goals for your website, see the guide.
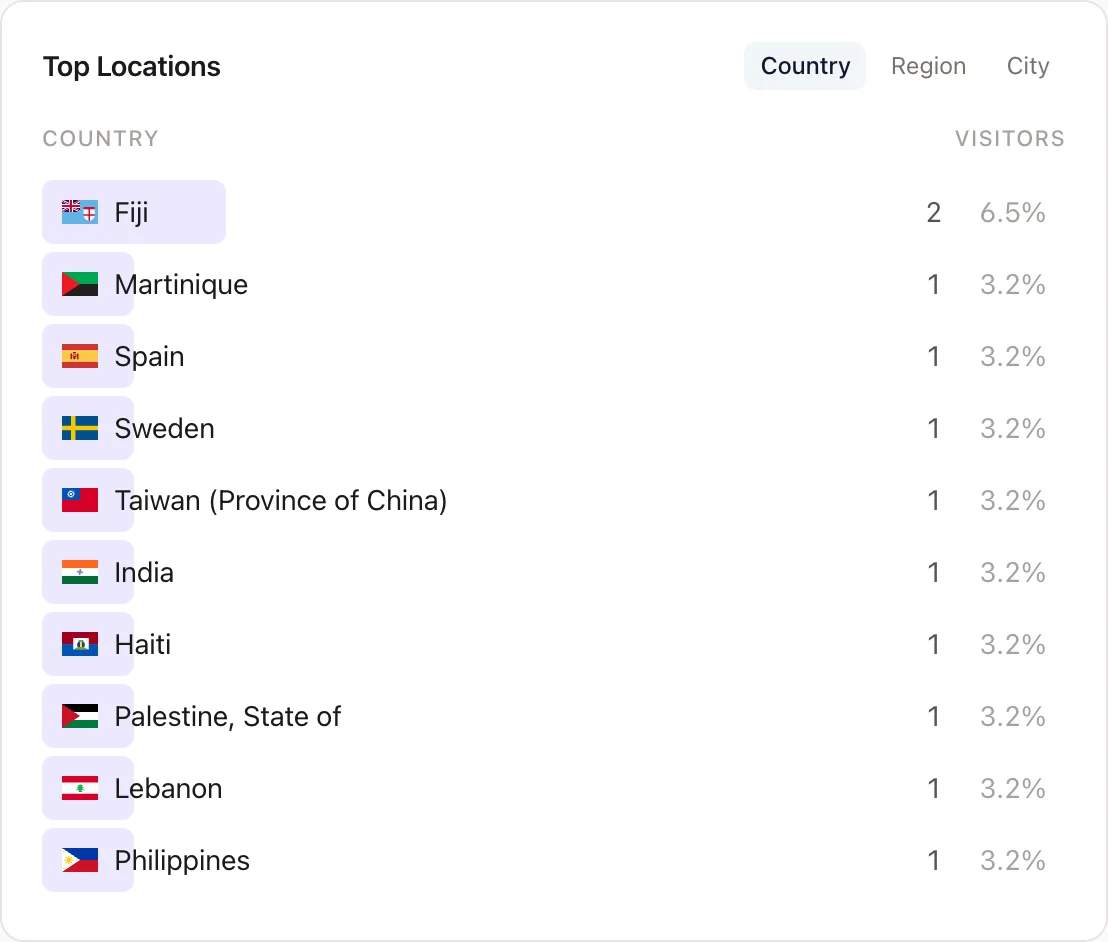
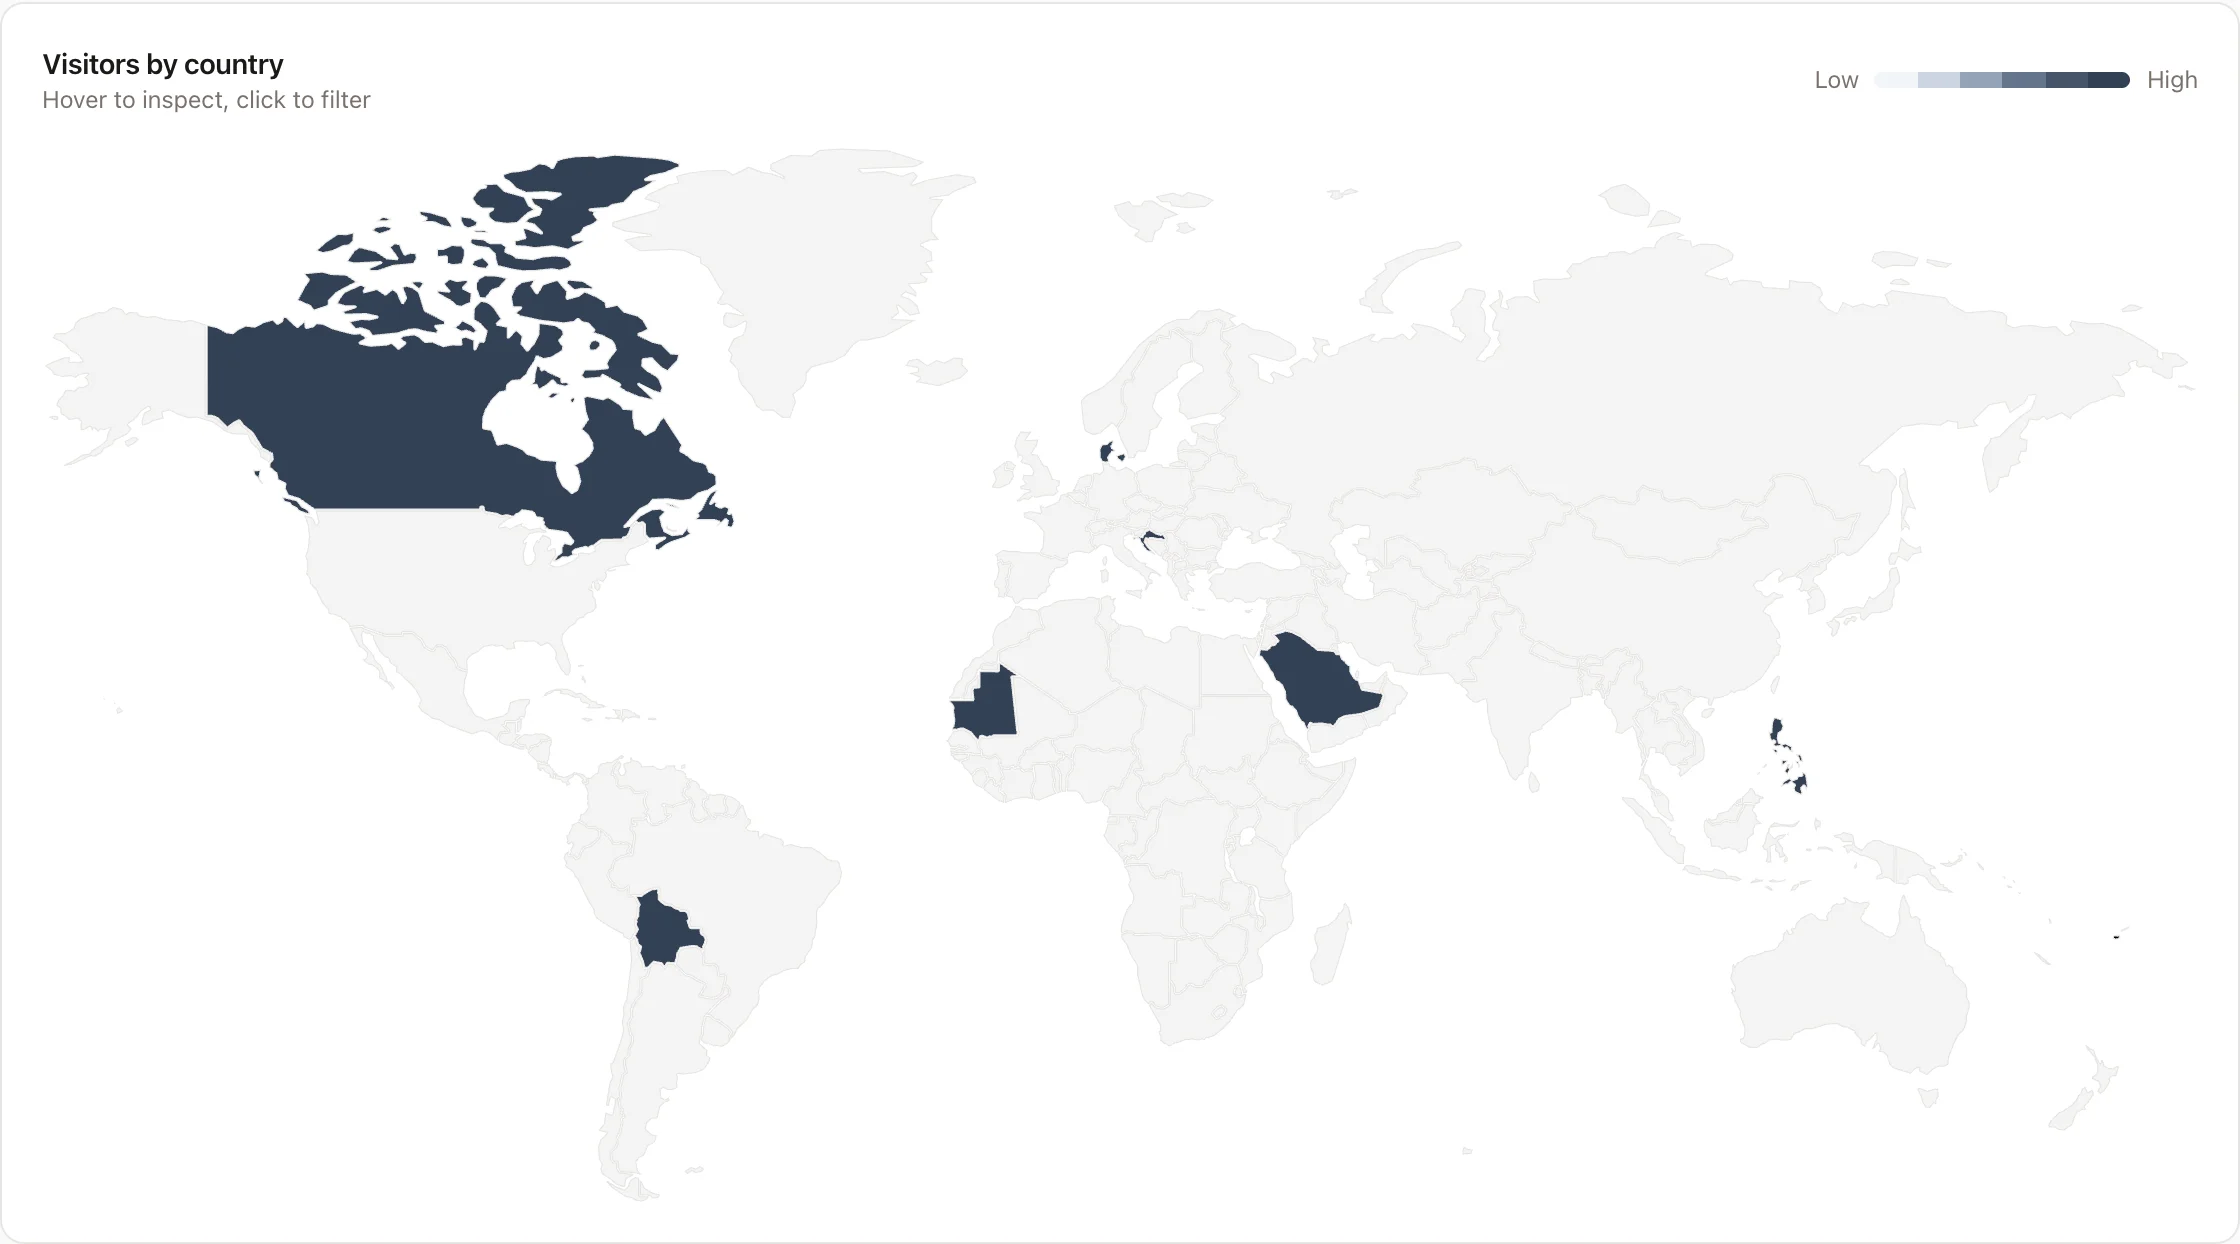
Locations
This section lists the top locations visiting your website, available as both a top list and a world map. Use the tabs to switch between countries, regions or cities.