

Everything, on every plan
There is no feature matrix here and no upsell tier. Every account gets all of it, and the only thing that changes with price is how much traffic you send.
Six numbers, live, unsampled
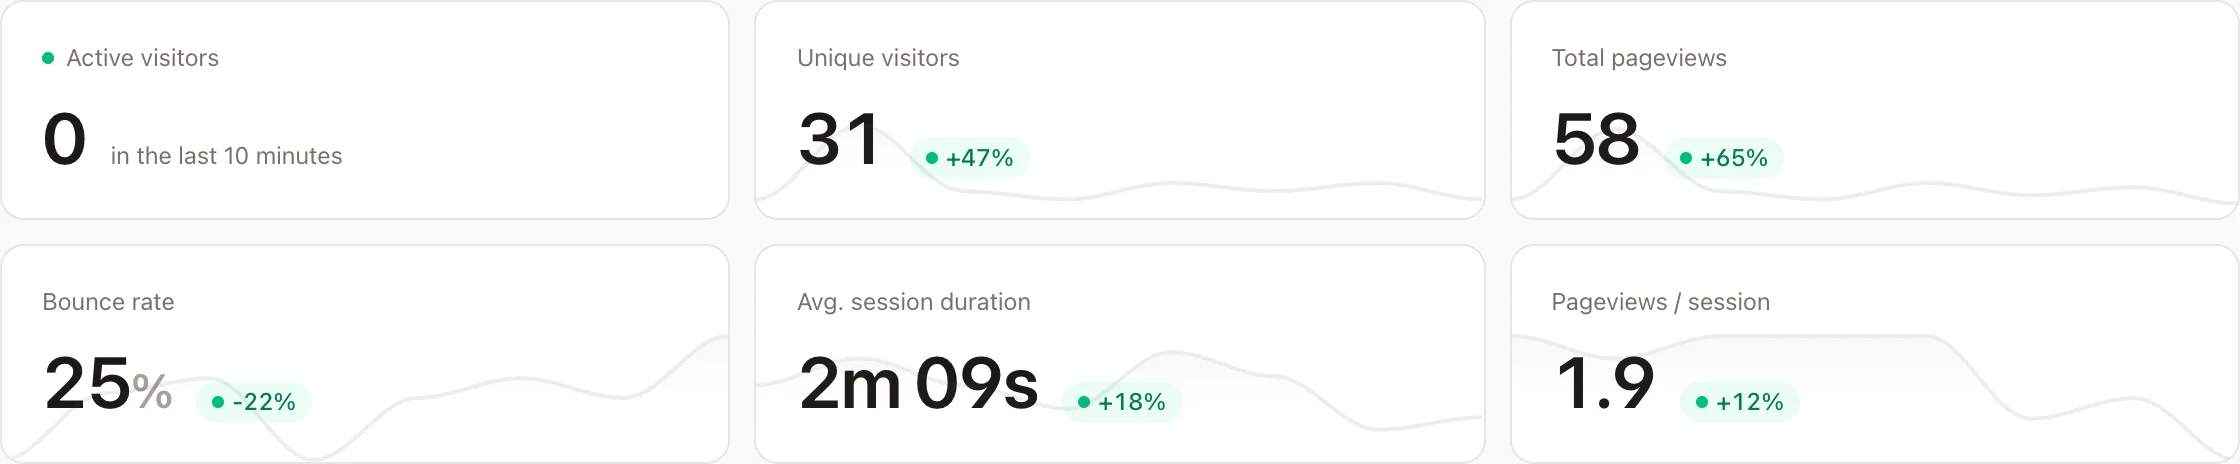
Active visitors over the last ten minutes, unique visitors, total pageviews, bounce rate, average session duration and pageviews per session. That is the whole tile row, and it is deliberately short.
Every number is computed from the raw events in ClickHouse at query time. Nothing is sampled, nothing is estimated, and there is no processing delay to wait out. A visitor who arrives while you are looking at the page is already counted.
Where the traffic actually came from
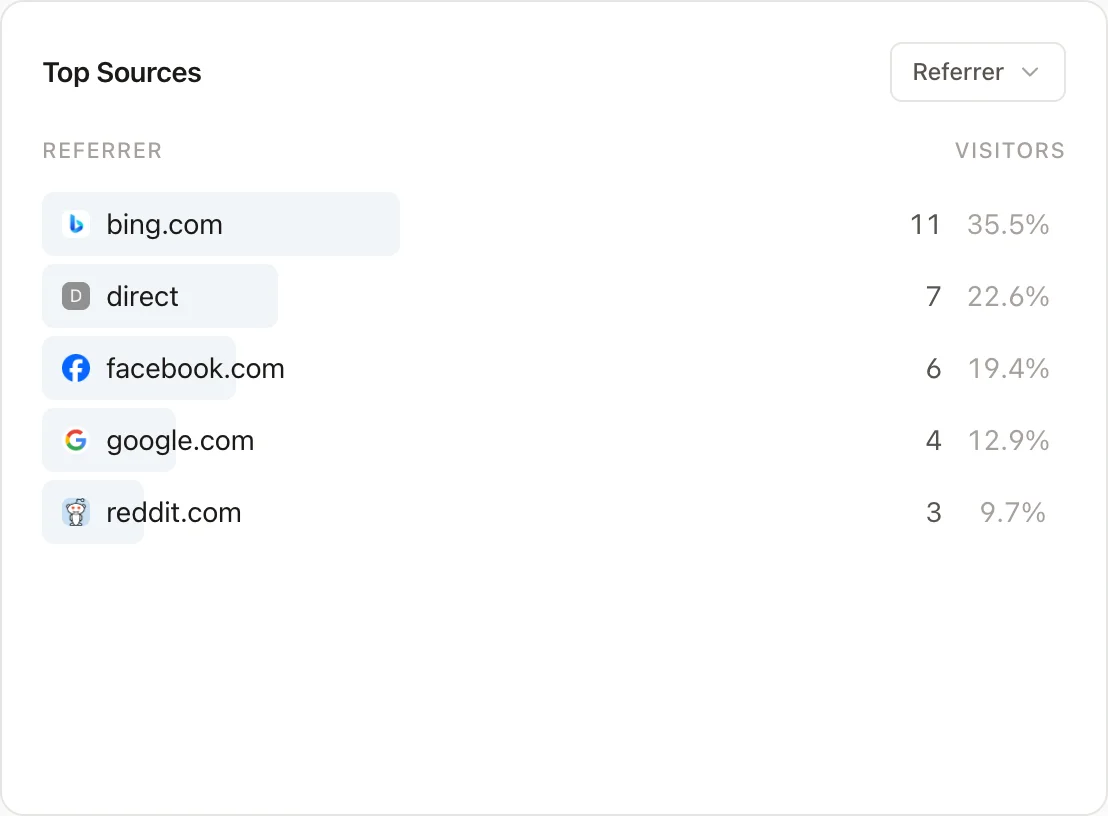
Referrers, with tabs for UTM source, medium and campaign, so a campaign you tagged properly is separated from the rest without any setup. Click any row and the whole dashboard filters to it.
Connect Google Search Console and a Search terms tab appears, showing the organic queries that brought people in, with impressions and click-through rate for the period. Google stopped putting search terms in the referrer in 2012, so this is the only honest way to get them.
Which pages hold attention, and which lose it
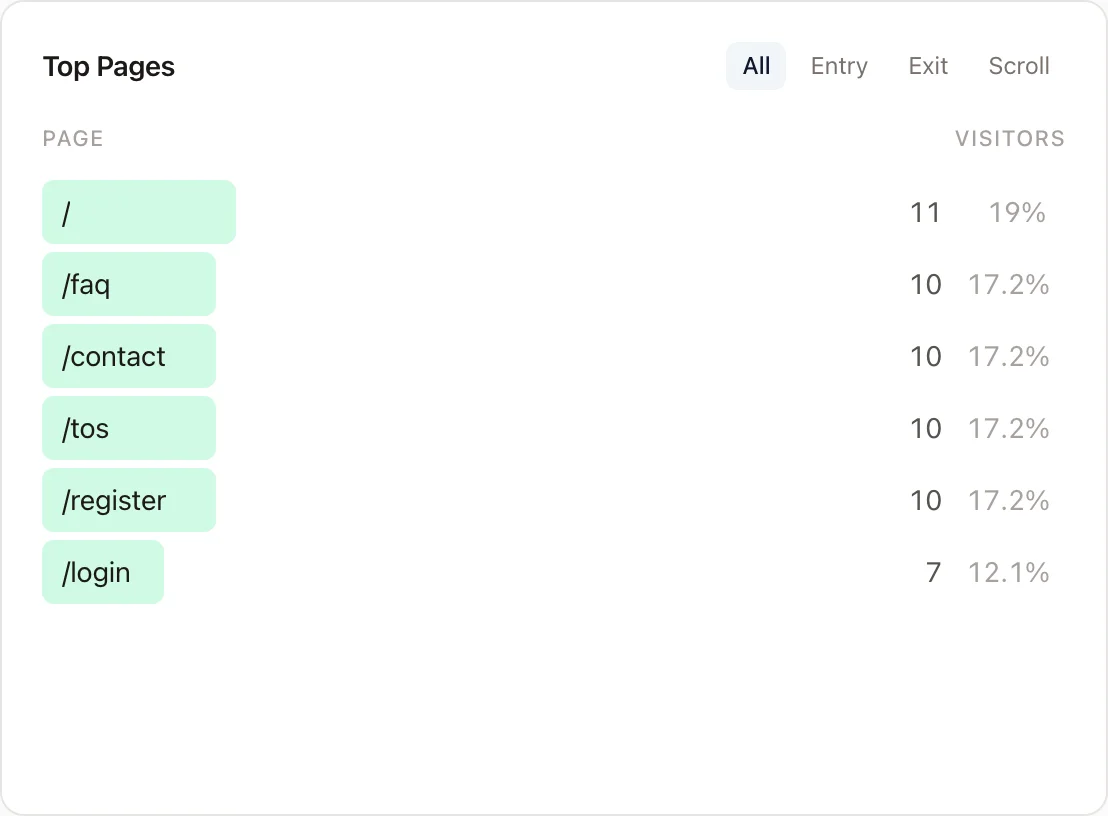
Pages by traffic, and separately as entry and exit pages, so you can see where people arrive and where they give up.
Scroll depth is measured per page as a share of the distance actually available to scroll, not of the document height. A short page does not flatter itself, and a page with nothing below the fold reports nothing at all, because "how far down did they get" has no answer when there is no down.
Goals that match how sites really work
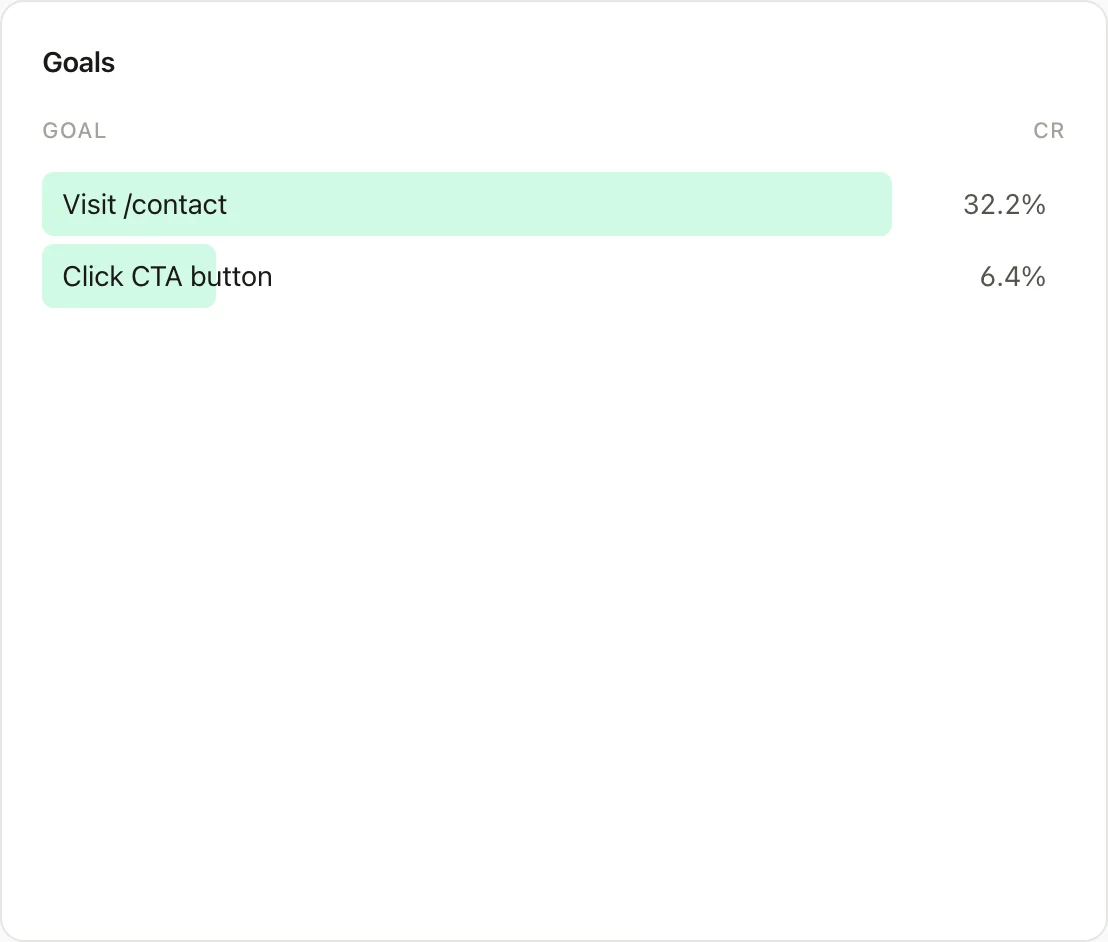
Three kinds of goal. A page goal fires on a URL, with wildcards, so
/checkout/* is one goal rather than forty. An event goal fires
on a custom event you trigger from your own code. A scroll goal fires when
someone gets past a depth you choose on pages you choose.
That last one exists because for a lot of sites the conversion is being read, and there is no button to click when it happens.
Track the things only you know matter
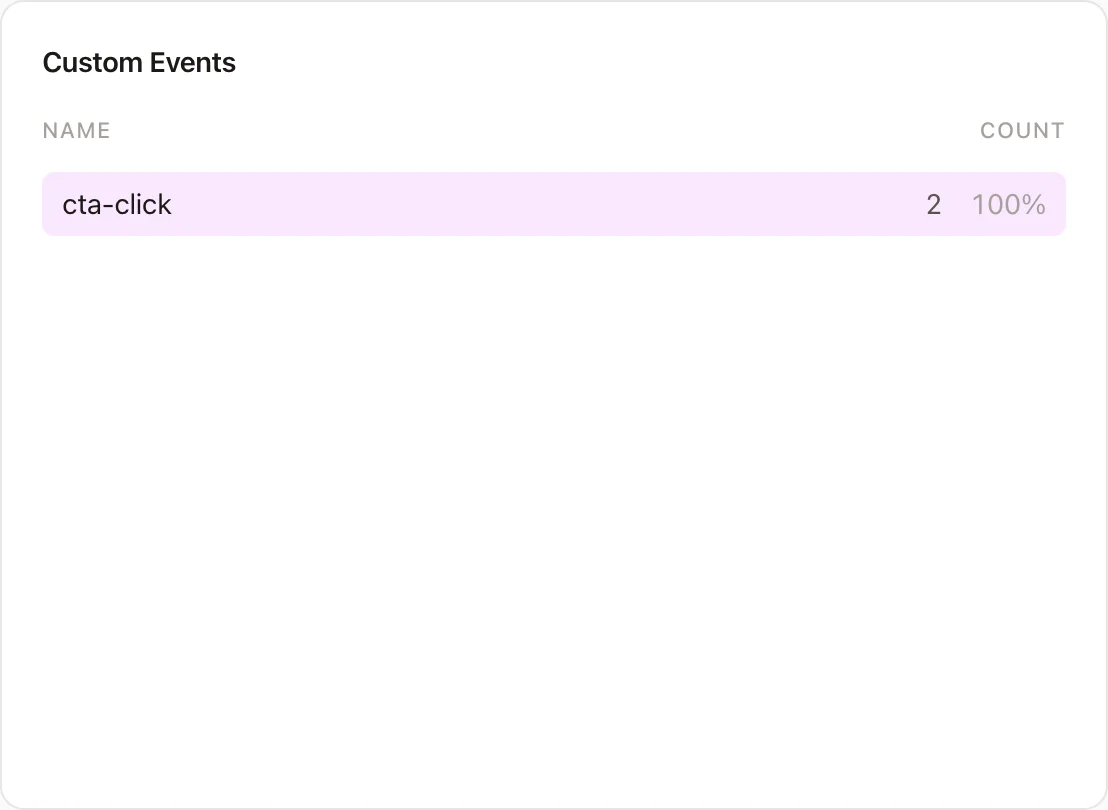
Call galytics.triggerEvent('name') anywhere in your code and it lands on the
dashboard. Events have to be registered in settings first, which is deliberate: it means a
typo in a template cannot quietly invent a new event and inflate your quota.
Goals can be built on events, so the same trigger can be both a raw count and a conversion.
Send conversions back to the ad platform
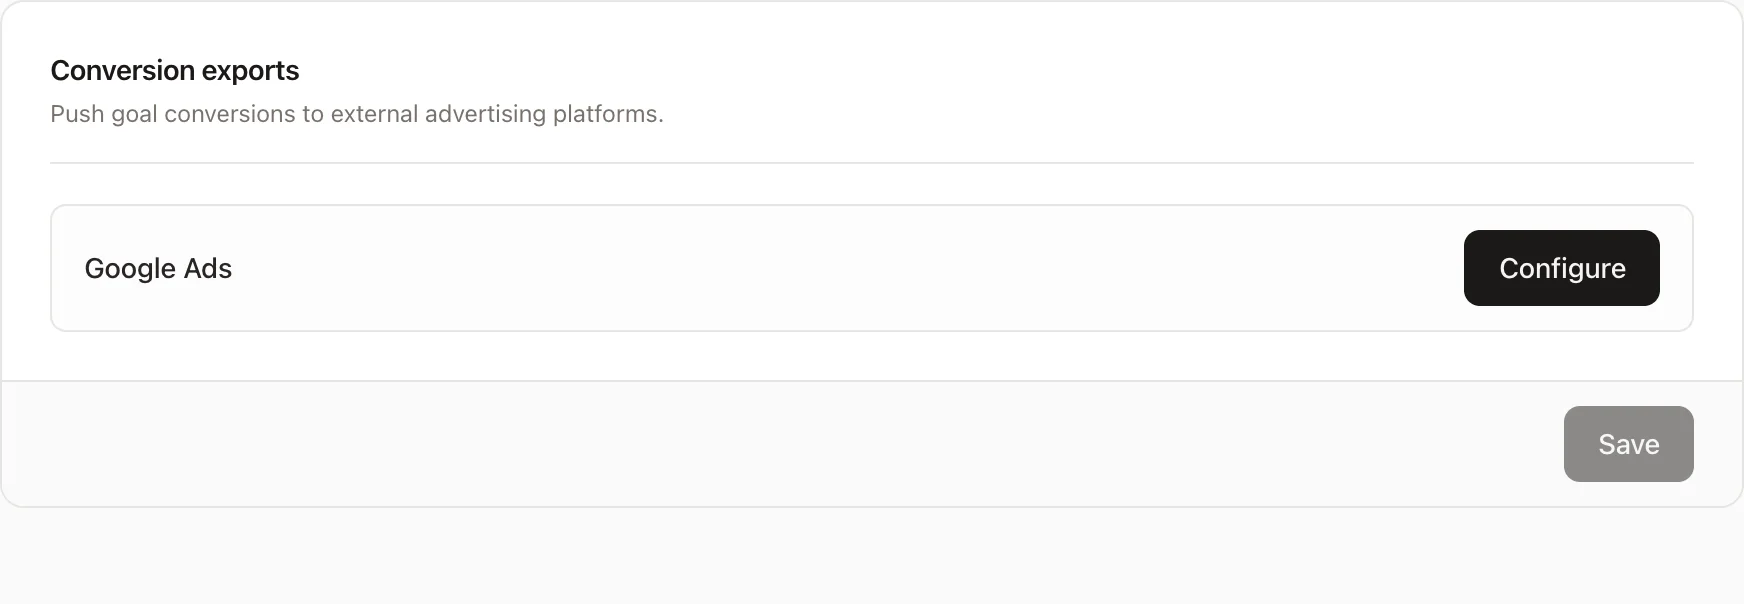
Pick which goals should count as conversions and export them to Google Ads, so bidding optimises against what actually happened on your site rather than a landing page view.
You get the feedback loop that makes ad spend work, without putting an advertising company's tracking script on your pages to get it.
Watch the session behind the number
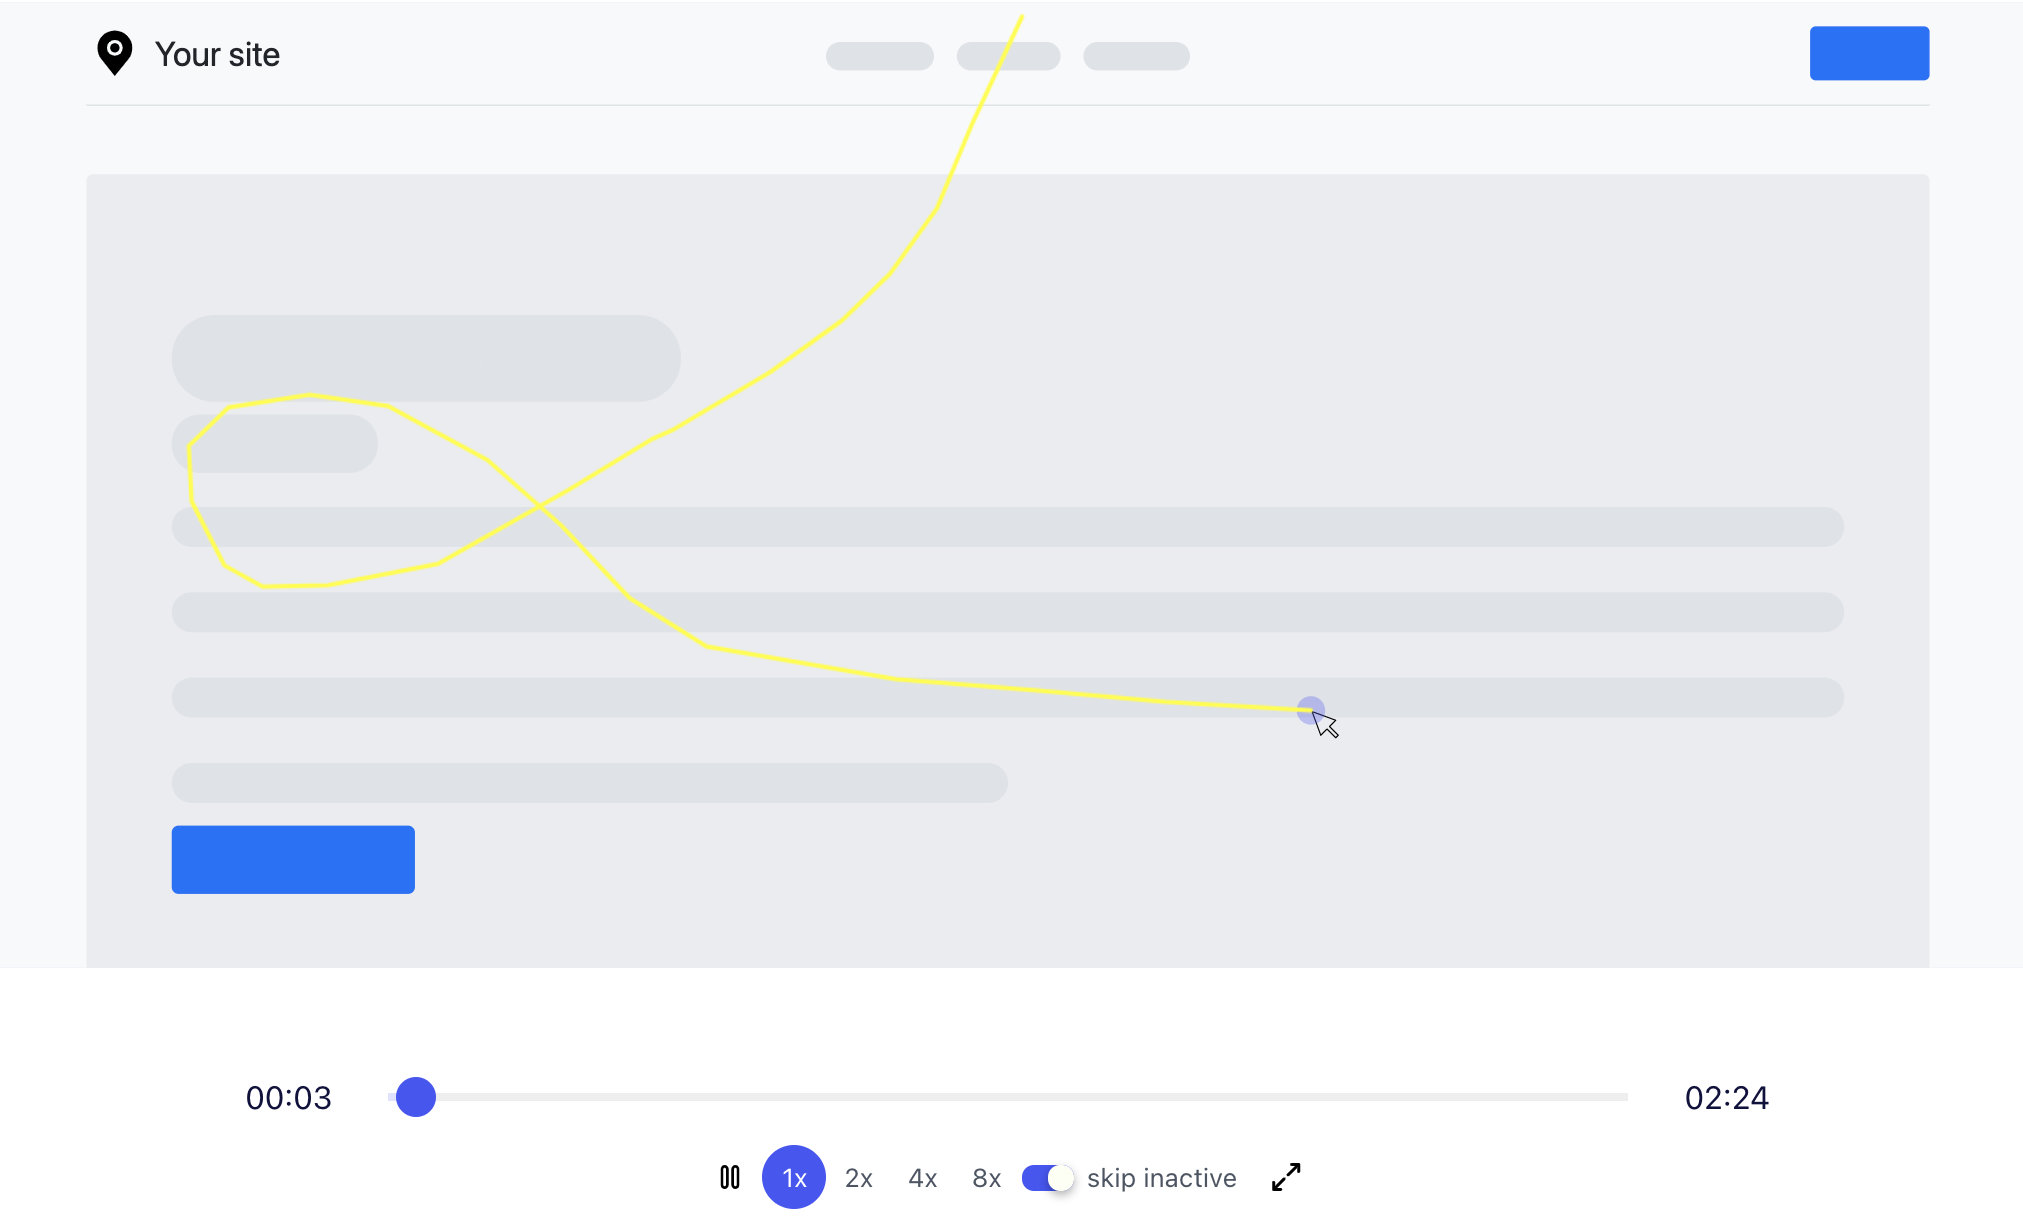
Every plan includes full session replay, recorded with rrweb and played back with scrubbing, variable speed and inactivity skipping. Every form field is masked in the browser before anything is sent.
Most cookieless analytics tools do not do replay at all, and the ones that can sell it as a separate add-on. Here it is in the same script, on every plan. How session replay works, or see it next to Hotjar and Microsoft Clarity.
Who they are, without knowing who they are
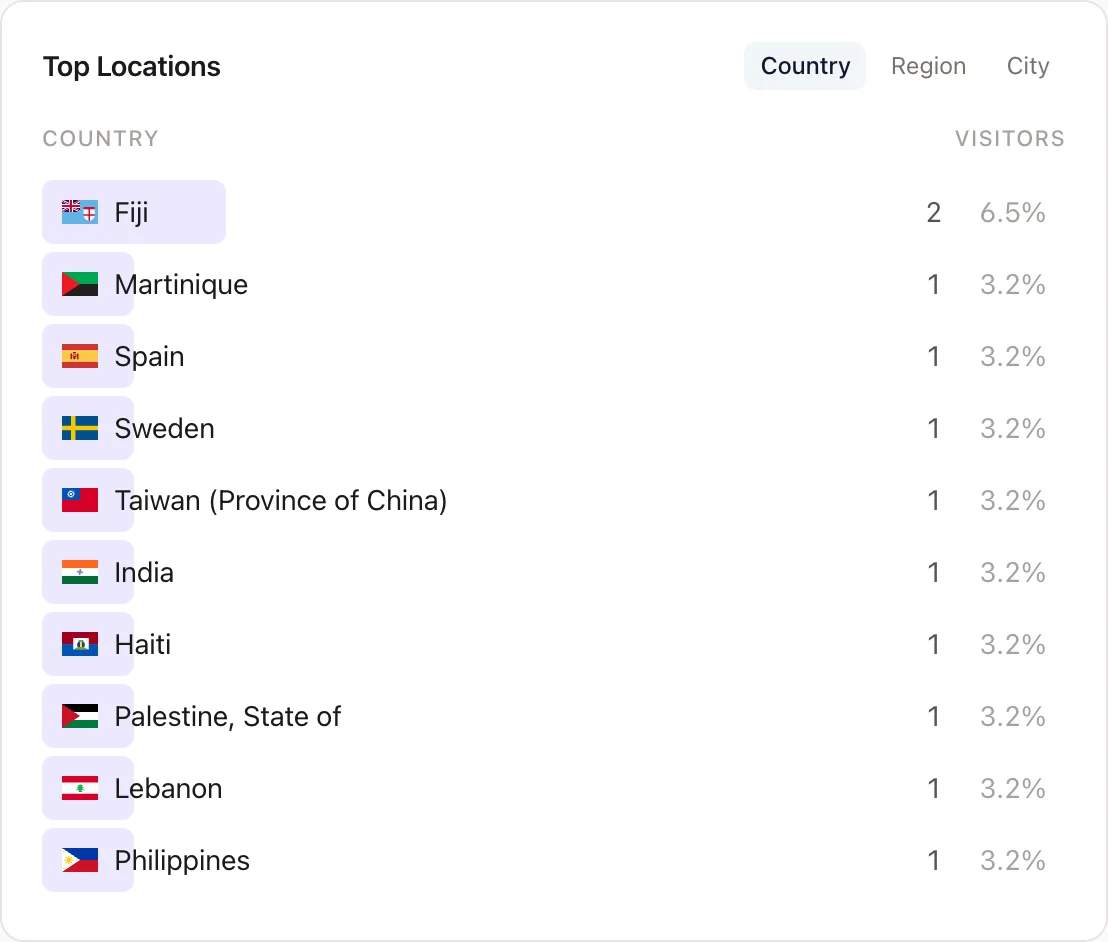
Countries on a map, plus browsers, devices, operating systems and screen resolutions. Click a country to filter everything else by it.
Country comes from the network edge, not from a GeoIP lookup against a stored address. No visitor IP is ever written down, and there is no fingerprint holding it together.
The numbers come to you
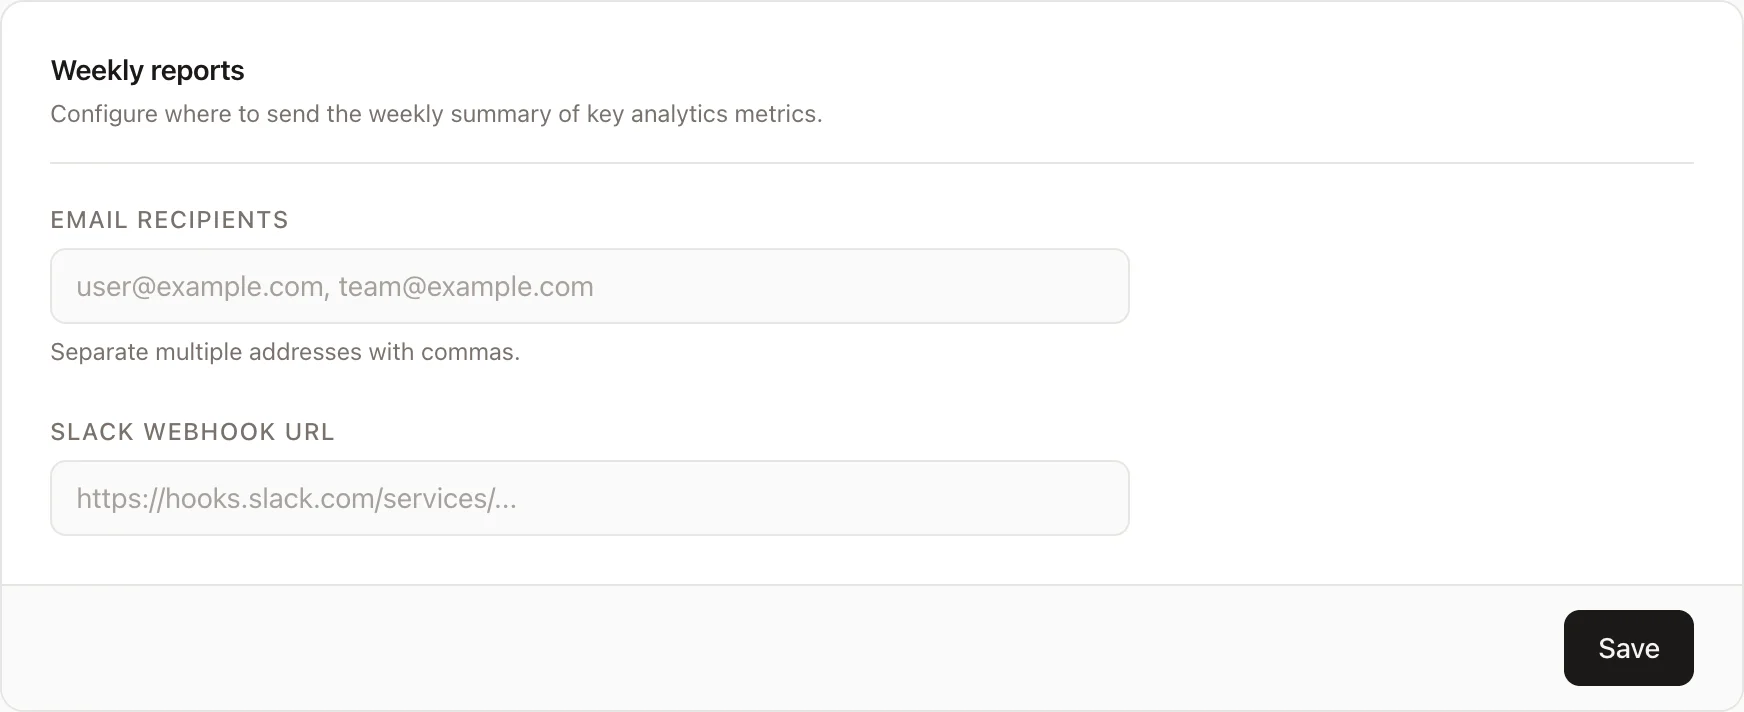
A weekly summary by email to as many addresses as you like, or into Slack. Enough to notice something moved without opening a dashboard every morning.
Everything is exportable to CSV when you want to do your own analysis, because it is your data and it should not be stuck in our interface.
Filters, teams and the boring necessities
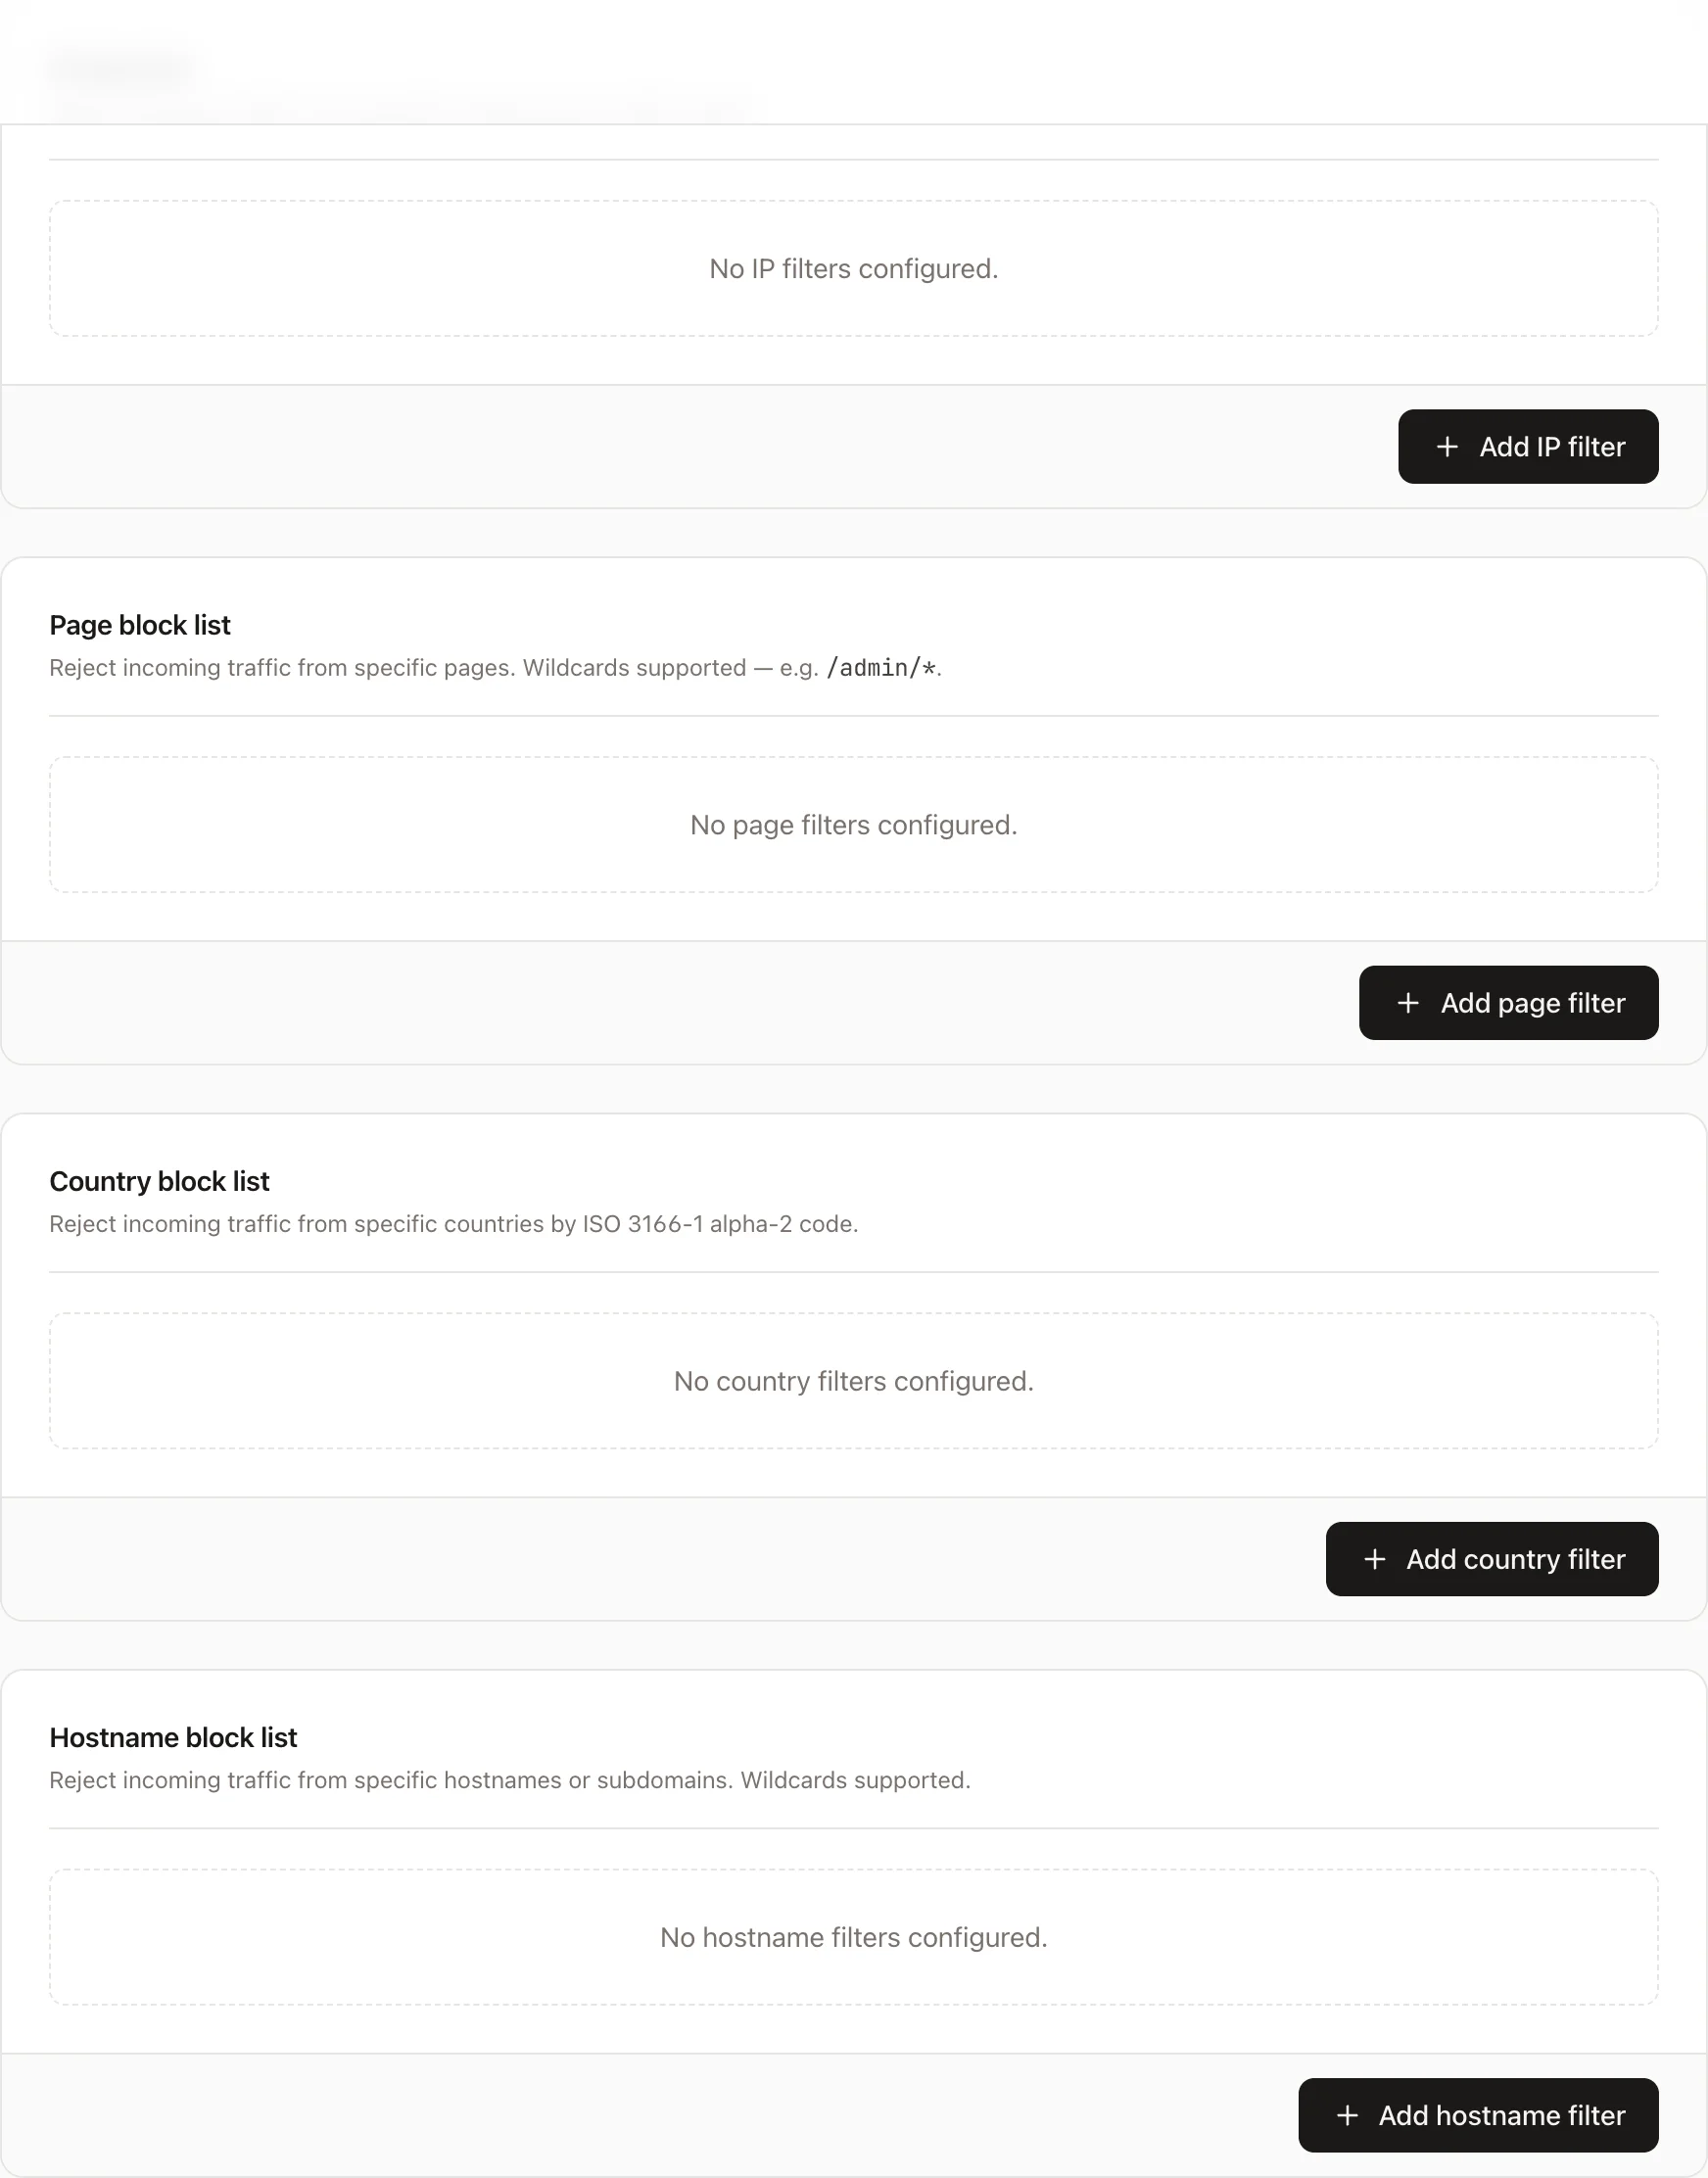
Filter out your own office by IP, staging paths by page pattern, or a country that only ever sends bots. Filtered traffic never contaminates the numbers.
Unlimited websites and unlimited team members with roles, on every plan. We do not charge per seat, because charging a company for letting one more person look at a chart has never made anyone's product better.
One script, no consent banner
All of the above runs without a single cookie, which is why there is nothing to ask permission for and nothing to hold back behind a banner. Analytics alone is under 2 KB gzipped. With session replay it is about 25 KB, still one async request.
Start your 30-day trialNo credit card · Cancel anytime · Hosted in EU